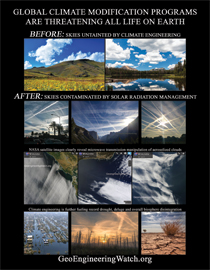
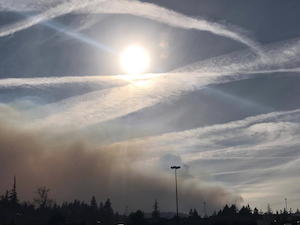
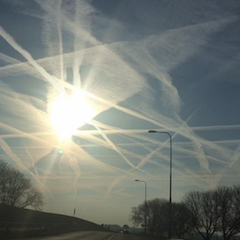
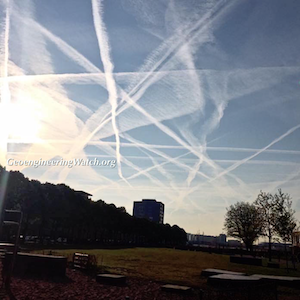
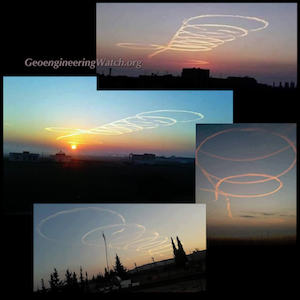
Though the data from the ground outlined in the article below is valid, it is ever more incomprehensible that the entire climate science community continues to totally omit any mention of the geoengineering elephant in the room. This being said, the rest of the information contained in articles that are giving up to date reports from the front lines is still valid. We must all learn to sift the baby from the bathwater, to connect the appropriate dots. The climate unraveling and meltdown is accelerating by the day, there will be no hiding the gravity of what we face much longer. As the curtain is pulled back, geoengineering will become ever harder to keep from the public view. We must all look at the wider horizon, not just through the lens of already formed conclusions of reality based on headlines and the opinions of our peers.
Dane Wigington
geoengineeringwatch.org
Late June 2014: Arctic in Hot Water as Sea Ice Thins and Tundra Fires Erupt
Atmospheric warming due to human-caused climate change. It’s the general measure we’ve used to track a devastating and ongoing heat amplification due to a terrible greenhouse gas emission. But if we were to look for where the greatest amount of that heat has accumulated, it would be in the world’s oceans. For from its air-contacting surface to its depths thousands of meters below, the World Ocean has captured 93.4% of the total heat forcing humans have already unleashed. The remainder is almost evenly divided between the atmosphere, the continents, and the ice.
We rely on floats and deep-plunging sensors to keep track of total ocean heat content. But on any given day we can see well enough what is happening at the surface. And today ocean surface heat is screaming through the world’s satellite sensors. Overall global anomalies are spiking higher than +1 C above the 1979 to 2000 average. In the Equatorial Pacific, an El Nino that looks to be far stronger than the one that occurred in 2009-2010 is building, heating a massive wedge of the Eastern Equatorial Pacific to +2 to +4 C above average. And in the far north, we see extraordinary high surface water temperature departures exactly where we need them least — bordering Greenland and the remaining Arctic sea ice.
(Arctic sea surface temperature anomaly on June 24, 2014. Image source: NOAA/NWS.)
For encircling the Arctic from the West Coast of Greenland, to Iceland, to Svalbard, to the Barents and Kara Seas, to the Chukchi and on to the Beaufort we see surface water temperatures ranging from 2.25 to 4 C or more above average. And just west of Svalbard, we have water temperatures ranging in a zone exceeding a terrifying 8 C above average. When a sea surface temperature departure of 0.5 to 1 C above average is considered significant, these values represent extremes that are far outside what was once considered normal.
Melt Pressure to Ice Sheets
Such high surface water temperatures have numerous effects. The first is that adjacent submerged ice sheets, such as the calving faces of Greenland’s great glaciers plunging into the ocean, are faced with a far greater melt pressure than before. The glacial fronts in many cases expose 500 or more feet of ice directly to these much warmer waters. And on almost every side of Greenland, but especially in the west, along Baffin Bay, these great ice masses are confronting extraordinary warmth. The heating is without respite. It occurs at all hours of the day and since it is delivered by water, it is many times more energy intensive than a similar volume of equally heated air.
Widespread Sea Ice Thinning and Melt
In the sea ice edge zone, the warmth also provides added heat pressure to the vulnerable and already greatly thinned ice floes. This heating is especially apparent in areas where continental rivers disgorge their waters into the Arctic Ocean. Warmer than normal water temperatures have coincided with much warmer than normal land temperatures, particularly over tundra regions like Canada’s Northwest Territory and the Yakutia region of Russia. These warmer lands result in warmer river flows. And the hot rivers spill into an already hotter than usual Arctic Ocean.
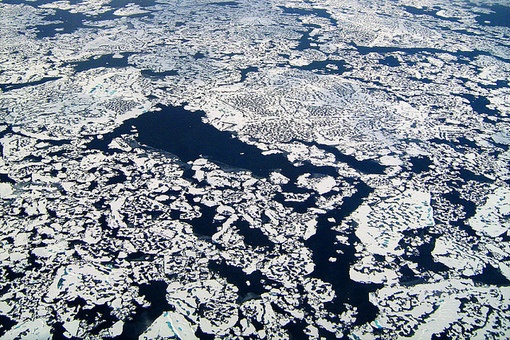
The result, as we can see in today’s MODIS satellite shots are numerous zones of greatly thinned ice.
(Ice melt, thin ice and melt ponds in the Beaufort Sea on June 25 of 2014. Image source: LANCE MODIS.)
A Beaufort Sea confronted with warm water outflow from the Mackenzie River, sea surface temperatures in the range of +1 to +4.5 C above average, and a broad swath of above freezing air temperatures, is now starting to show major melt effects. The sea ice has already withdrawn by as much as 150 miles from a broad section of the Canadian and Alaskan coasts. The off-shore ice features numerous very large polynyas and leads. And, overall, the ice has taken on a bluish tint indicative of widespread melt pond formation.
(Arctic Sea Ice over the Laptev and East Siberian Seas. Image source: LANCE MODIS.)
Meanwhile on the far side of the Arctic, effects appear to be even more widespread. Though sea surface temperature values are somewhat lower than those seen in the Beaufort, at +0.5 to +1.25 in most open water areas, the entire region is rife with 150-200 mile wide polynyas, shattered and broken floes, and thinning (blue in the satellite picture) ice covered in melt ponds. The ice in this region is so frail that even the mildest storms, featuring 15-20 mph winds, are enough to rip through and splinter previously contiguous ice. And the storms in the region this year have been quite mild, ranging from 990 to 1000 mb in strength.
Sea ice measures show current area and extent at between 3rd and 5th lowest on record. That said, observed ice response to even the mildest high and low pressure weather systems reveals a startling vulnerability with much warmer than normal sea surface temperatures surely a contributing factor.
Wildfire Eruptions From The Northwest Territory to Siberia
In net, much warmer water temperatures and retreating sea ice in the Northern Hemisphere trigger both Jet Stream erosion and increasing south to north air flow. Over the continents, where lands are far more susceptible to rapid warming, this can result in Arctic regions seeing summer time temperatures comparable to those in latitudes much further south.
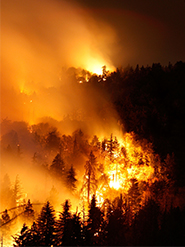
Over the past week, temperatures in the upper 70s to upper 80s (Fahrenheit) covered a broad region of Canada’s Northwest Territory including Alberta and the Mackenzie Delta region along the Beaufort Sea. These temperatures, in the range of 20-25 F above average rapidly dried out the shallow topsoil zone over the frozen and thawing tundra. Such rapidly dried soil and newly liberated tundra is a volatile fuel for fires. The human-thawed tundra itself contains burnable organic material and hosts pockets of methane while the dry soil bed is suffused with tinder-like grasses and shrubs. Any ignition can set off extraordinary fires of almost unimaginable scope and intensity.
(Massive fires rage near Great Slave Lake in Canada on June 24, 2014. Image source: LANCE MODIS.)
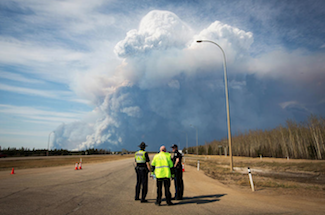
By June 24, four massive fires, each with a front ranging from 20-30 miles in breadth, raged along the shores of Great Slave Lake in Northwest Canada. Four smaller, though still significant fires also burned nearby. The fires are plainly visible as white, comet-like plumes of smoke in the satellite picture above. For reference, Great Slave Lake is more than 200 miles across at its widest point. Bottom edge of frame is about 300 miles.
To the south and east by about 250 miles lies the Fort McMurray tar sands operation. A smaller, though still intense, tundra fire raged within 20 kilometers of that sprawling site but did not yet encroach on one of the most powerful and dangerous means of carbon-to-atmosphere delivery on the planet.
On the other side of the Arctic in Siberian, Russia, the situation was, once again, more dire. There a region very vulnerable to mid summer wildfires during recent years erupted into numerous blazes belching smoke into a swirling cloud caught up in the heat dome overhead:
(Massive region of wildfires North of Lake Baikal, Russia. Image source: LANCE MODIS.)
These fires were sparked by temperatures that, during recent days, ranged in the 80s and even 90s. An extraordinary heat forcing for rapidly melting tundra regions that also saw far warmer than typical temperatures this past winter.
This area, about 800 miles to the north of Lake Baikal, Russia, is a region of rapidly thawing tundra that has burned again and again during recent summers. For scope, the satellite shot frame, above, is 750 miles on an edge. In the picture are about 50 fires with fronts ranging from 4-35 miles.
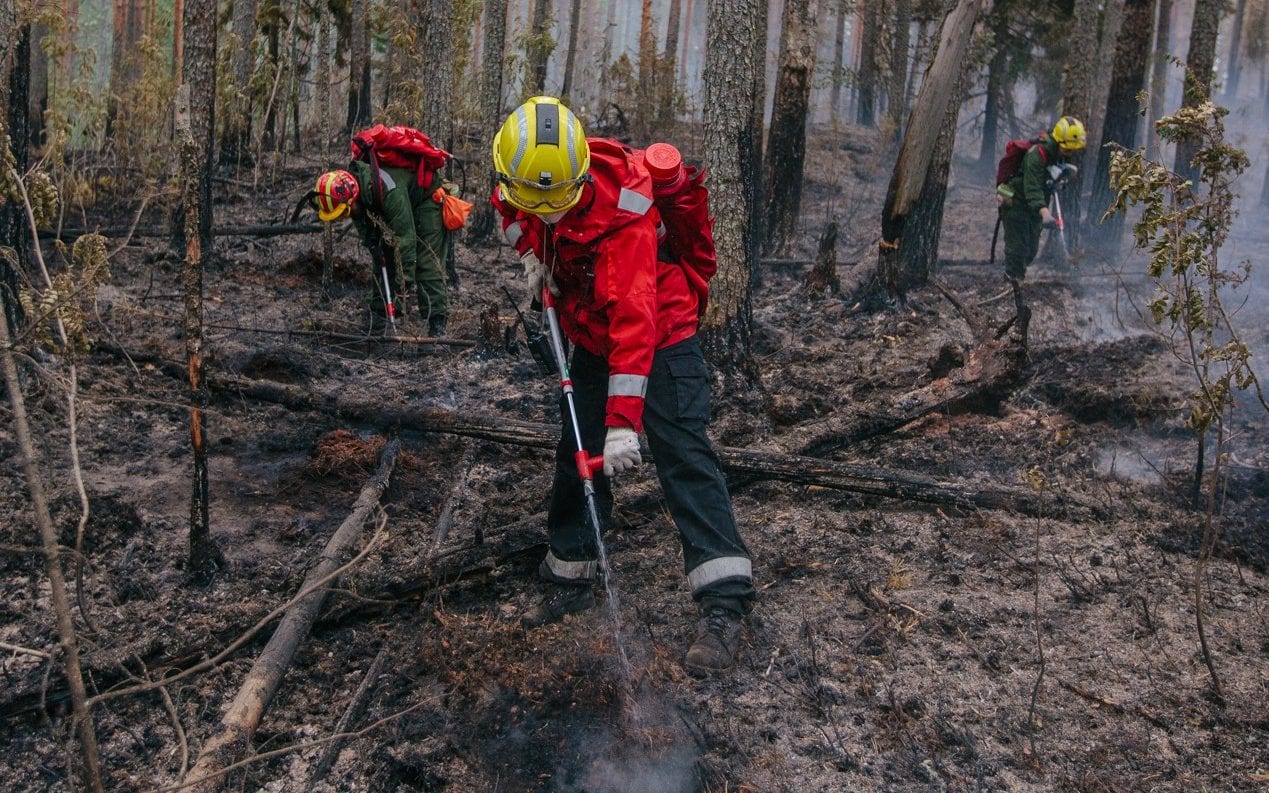
This spring, a broad area to the south of the current fire zone and just north of Lake Baikal saw massive fire activity prompting Russia to dispatch an army of hundreds of firefighters to the region. Such intense fire activity so early was unprecedented for Russia. But the real fire season typically peaks from mid July to August. And, in the above picture, we see what is likely the opening salvo for the summer fire season in earnest.
Smoke and soot from these massive fires are swept up in the circumpolar Jet Stream. There they are born aloft for hundreds of miles, often traveling northward to find a final resting place upon the sea ice or atop Greenland’s glaciers. This ultimate darkening of the snow further enhances glacial melt even as it completes the cycle of warmth, finishing a dance of heat that rises up from the oceans, assaults the ice, and heats the once frozen lands to erupt in flame.
Source: Robert Scribbler


