The Great Greenland Meltdown
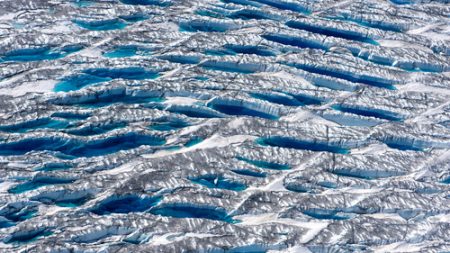
Source: ScienceMag.org From a helicopter clattering over Greenland's interior on a bright July day, the ice sheet below tells a tale of disintegration. Long, roughly parallel cracks score the surface, formed by water and pressure; impossibly blue lakes of meltwater fill depressions; and veiny networks of azure streams meander west, flowing to the edge of the ice sheet and eventually out to sea. The scientists flying over the world's largest thawing chunk of ice have selected a particularly auspicious summer to be studying the melt. The edges of Greenland's 1.7-million-km2 ice sheet regularly melt in summer, even in years when the ice sheet as a whole grows because of snowfall in its higher, colder center. But in 2016, the melting started early and spread inland fast. By April, 12% of the ice sheet's surface was melting; in an average year the melt doesn't reach 10% until June. And just before the scientists' journey, a violent river of meltwater, one of hundreds coursing out from the ice sheet, swept away a sensor, bolted to a bridge to measure the water's turbidity. It was the second time in 4 years such a device had fallen victim to the liquid fury of the glaciers. "I've been doing these trips for years, but I've never seen so much water," the helicopter pilot told the researchers.
Climate Engineering, Cooling Wealthy Nations While Poorer Countries Incinerate
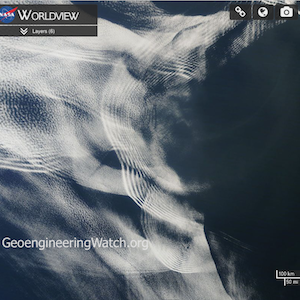
Dane Wigington GeoengineeringWatch.org How is it possible that the abrupt climate shift unfolding on our planet is not creating nearly as much heat in wealthy nations as compared to poor countries? This, now statistically proven scenario, is yet another glaring red flag to confirm the ongoing global climate engineering insanity being carried out by militarized / industrialized nations. Highly toxic and environmentally devastating global geoengineering programs are a primary tool and weapon of the more powerful nations. The worldwide weather modification assault has been used to confuse and divide populations in regard to the true state of the climate and the true extent of the threat that we collectively face. The ongoing effort by the climate engineers to mask the full degree of climate damage from first world populations has been aggressive and consistent. Geoengineered skies, Šiauliai, Lithuania. Photo credit: Zenonas Mockus Recent studies have now proven that a completely unnatural global temperature scenario is taking place which would not be possible without the existence of ongoing climate intervention programs. Temperatures in high income nations are rising at a far slower rate than low income nations. Based on an average of three data reanalyses, the researchers found the percentage of hot days each year in low-income countries rose from a base of 10 per cent – or 37 days – during the 1961-90 base period to 22 per cent – or 80 days – by 2010.By contrast, rich nations had the percentage of hot days rise much slower, from 10 per cent to 15 per cent, or 37 to 55 days. Click image to enlarge These graphs show an astoundingly unnatural scenario which is virtually impossible without massive climate intervention programs. "It's not good for low-income or high-income countries but it's particularly worse for the low-income countries as they are the ones which can least afford to adapt," (Dr. Nicholas Harold from the Climate Change Research Center at the University of New South Whales). Poorer nations typically have far smaller accumulated or annual per-capita greenhouse gas emissions than industrialised ones. With the uneven warming trends likely to continue, poor nations have a case for demanding rich world assistance to cope with climate change… Poor countries have "contributed the least, but in terms of temperature effects, they will suffer the most". "A Somaliland goat herder besides the carcasses of some of his last remaining animals, which had just starved to death" (Ashley Hamer/VICE News) Even within the boundaries of wealthy nations, the climate engineering signature of completely out of balance temperature contrasts are clearly visible. Geoengineered weather whiplash continues to batter the US (and other nations) with historically unprecedented abrupt temperature swings and shockingly stark temperature boundaries. Click image to enlarge Each color tier in the NOAA long-lead forecast map above (the scheduled weather) represents a temperature departure from normal of 3-4 degrees (blues for below, reds for above). Temperatures 25 or 30 degrees above normal will persist in regions of the southern US while incoming Pacific moisture will continue to be chemically ice nucleated to cool down the Pacific Northwest. Antarctic sea ice extent has been commonly referred to by "global warming is a hoax" disinformation sources as "proof" that the planet is not warming. The latest sea ice data from Antarctica is reflected in the graph below. The sea ice at the bottom of the world is at record low levels and still plunging. Geoengineering can and is creating short term highly toxic cool-downs at the cost of an even worse overall warming and an accelerated climate disintagration. Click image to enlarge The ice levels at both poles is at record low levels. In the graph below a slight statistical decline of global temperatures can be seen after the peak warm year of 1945. This 30 year temperature "hiatus" from 1945 to 1975 perplexed climate scientists that were unaware of the geoengineering / solar radiation management programs that had been deployed just after WWll. Click image to enlarge As the countless negative consequences of climate engineering began to manifest in the mid to late 70's (and the greenhouse gas buildup continued), the military industrial complex simply doubled down on the geoengineering insanity. They have been doing so ever since. Though there are countless forms of anthropogenic damage to the planet, climate engineering is the single most destructive of all (short of nuclear cataclysm). What can we do to expose and halt the global geoengineering assault? Each of us can do a great deal to help with advancing this most critical cause, but we must all take action if we are to have any chance of changing directions. Click HERE for more input on what you can do to help. DW May be freely reprinted, so long as the text is unaltered, all hyperlinks are left intact, and credit for the article is prominently given to GeoengineeringWatch.org and the article’s author with a hyperlink back to the original story.
Australia’s Heatwave Continues With Record Temperatures Forecast

Source: The Guardian NSW and Queensland brace for hottest February day on record, putting paramedics on high alert. New South Wales is expected to experience its hottest February day on record this weekend with emergency services on high alert for catastrophic fire conditions. A state-wide total fire ban has been declared for Saturday as the mercury was set to soar past 40C. “If you’re a little bit inland from the coast in Sydney or the Hunter district, you’ll experience probably mid-40s,” senior forecaster at the Bureau of Meteorology Andrew Haigh said. “That goes for anywhere west of the ranges as well.”
‘Beyond The Extreme’: Scientists Marvel At ‘Increasingly Non-Natural’ Arctic Warmth
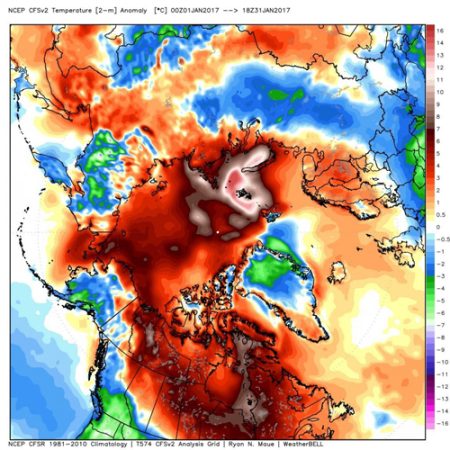
Source: The Washington Post The Arctic is so warm and has been this warm for so long that scientists are struggling to explain it and are in disbelief. The climate of the Arctic is known to oscillate wildly, but scientists say this warmth is so extreme that humans surely have their hands in it and may well be changing how it operates. Temperatures are far warmer than ever observed in modern records, and sea ice extent keeps setting record lows.
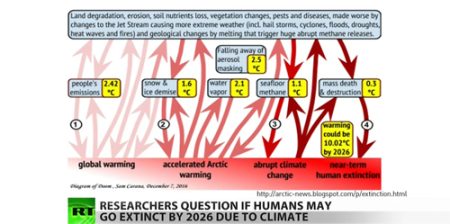
Humans Could Be Extinct In 9 Years – Scientists
Abnormal Antarctic Heat, Surface Melt, Giant Cracks In Ice Shelves — More Troubling Signs Of A World Tipping Toward Climate Chaos
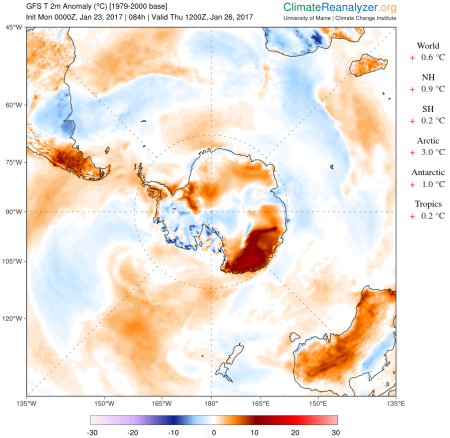
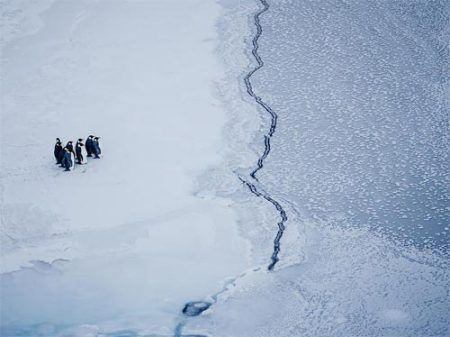
Source: Robert Scribbler Around its edge zone, and from glacier top to ice shelf bottom, Antarctica is melting. Above-freezing surface temperatures during the austral summer of 2016-2017 have resulted in the formation of numerous surface-melt ponds around the Antarctic perimeter. Large cracks grow through Antarctic ice shelves as warmer ocean currents melt the towering glaciers from below. The overall picture is of a critical frozen region undergoing rapid change due to the human-forced heating of our world — a warming that has brought Antarctica to a tipping point, for such fundamental alterations to Antarctic ice are now likely to bring about a quickening rate of sea-level rise the world over. Surface Melt Visible From Satellite During 2016-2017, Antarctic surface temperatures ranged between 0.5 and 1 degree Celsius above the already warmer-than-normal 1979 to 2000 average for most of Southern Hemisphere summer. While these departures for this enormous frozen continent may not sound like much at face value, they’ve translated into periods of local temperatures up to 20 C above average. As a result, measures around Antarctica along and near the coastal zone have risen above the freezing mark on numerous occasions. These periods of much-warmer-than-normal weather have in turn precipitated widespread episodes of surface melt.
What The World Would Look Like If All The Ice Melted
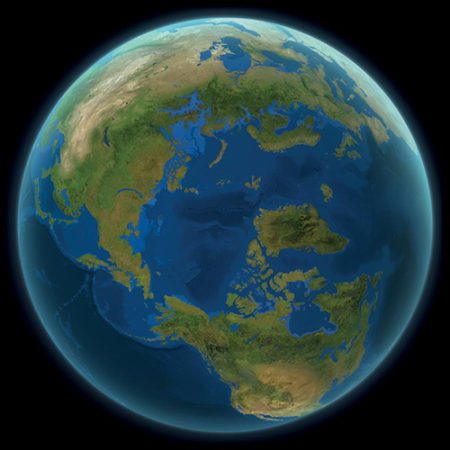
Source: National Geographic If we keep burning fossil fuels indefinitely, global warming will eventually melt all the ice at the poles and on mountaintops, raising sea level by 216 feet. Explore what the world’s new coastlines would look like. This story appears in the September 2013 issue of National Geographic magazine. The maps here show the world as it is now, with only one difference: All the ice on land has melted and drained into the sea, raising it 216 feet and creating new shorelines for our continents and inland seas. There are more than five million cubic miles of ice on Earth, and some scientists say it would take more than 5,000 years to melt it all. If we continue adding carbon to the atmosphere, we’ll very likely create an ice-free planet, with an average temperature of perhaps 80 degrees Fahrenheit instead of the current 58.
Earth Sets Heat Record In 2016 — For The Third Year In A Row
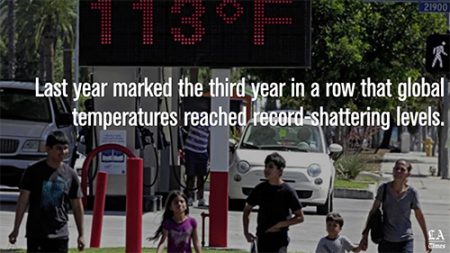
Source: L.A. Times, article by Amina Kahn According to independent analyses by NASA and the National Oceanic and Atmospheric Administration, the 1.78-degree jump over the mid-20th-century average marks the third year in a row that global temperatures have reached record-shattering levels. It’s official: 2016 was the hottest year on record since scientists began tracking Earth’s temperature more than 100 years ago, according to independent analyses by NASA and the National Oceanic and Atmospheric Administration.
The Arctic Sea Ice Collapse Is Happening Before Our Eyes — And It’s A Worrisome Sign Of What’s To Come
Source: Business Insider A member of a team of Cambridge scientists trying to find out why Arctic sea ice is melting so fast, walks on some drift ice 500 miles (800 km) from the North Pole September 3, 2011. Reuters/Stuart McDill As 2016 wound down and winter kicked into gear in the Northern Hemisphere, an ominous trend began in the Arctic: sea ice dipped to levels far below normal.
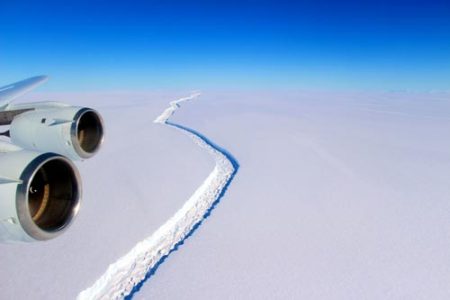
Huge Antarctic Iceberg About To Break Off And Slide Into The Sea
Source: Independent It isn’t clear what damage the huge iceberg will do to the surrounding landscape