Record Cold In A Record Warm World
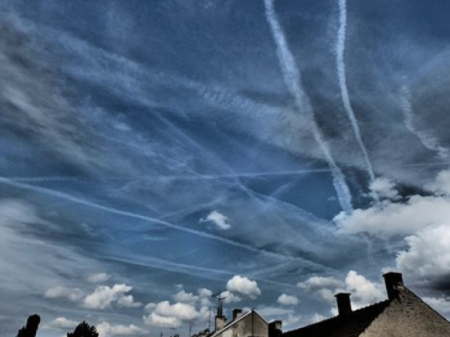
The geoengineers are going for broke with the latest all out engineered cool-down of the US. Their Rothschild owned Weather Channel theater and its cast of actors are trumpeting the “freezing planet” headlines, but what is going on with the climate in the rest of the world? The eastern half of the lower 48 states in the US is only 1/2 of a percent of the total surface area of the planet. If that’s only 1/200th of the total surface area, whatever is happening there certainly does not reveal the bigger global picture. Unfortunately, many that live in these “engineered cool-down” zones and many who only watch the corporate controlled media have completely taken the bait. So what is the larger global picture? The just released article below will shed some light on this question. Though the publication below of course does not mention the climate engineering elephant in the room, it does give clear and verifiable facts on the bigger picture. Dane Wigington geoengineeringwatch.org
Warmer In The Arctic Than In Texas? What Is Wrong With This Picture?
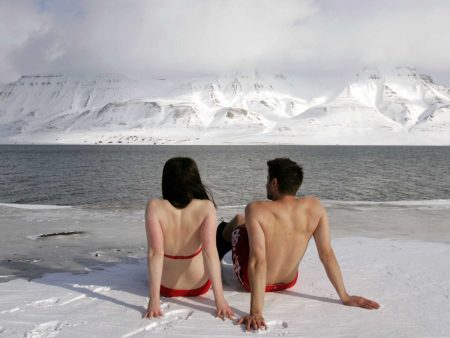
The global temperature maps in the article below are very telling as to where it’s hot and where it’s not. Why doesn’t the mainstream media take any time to tell us about the record warmth in Alaska and the Arctic? Why does the Weather Channel (and other mainstream sources) go through entire segments of their shows focusing exclusively on the engineered “record cold” while not even mentioning a word about the record warm temperatures elsewhere? Because it is their job to covertly sell climate engineering and confusion in regard to the true state of the climate. Dane Wigington geoengineeringwatch.org It’s Warmer In Alaska Than In Texas Right Now Source: Chron That’s according to the National Weather Service, which reported highs in the lower 30s Fahrenheit for Barrow, AK — the northernmost city in the country — but only in forecasted highs in the low 20s for Amarillo, TX.
Record High Temperatures In The Arctic While The Eastern US Freezes
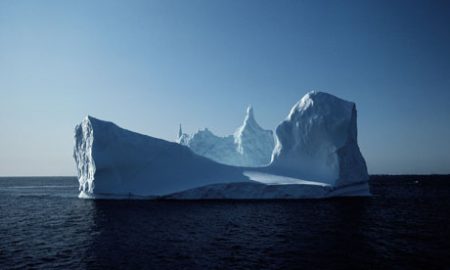
Temperatures in the Arctic as high as 50 degrees while the mercury is nearly 30 below at some locations in the Eastern US, what is wrong with this picture? Climate engineering is tearing the biosphere’s life support systems apart. The geoengineering elephant in the room continues to wreak havoc on the planet while the entire climate science community pretends not to know a thing about the climate engineering insanity. All are needed to help sound the alarm by passing out credible data to those that still have no clue about what is going on in our skies. Start “spot fires” of awareness everywhere you can, every day counts.Taking a daily compass heading of data from multiple sources is imperative for reaching solid conclusions on exactly what is unfolding. We must all work together, everything depends on our unity in this battle. The article below does not mention climate engineering as is to be expected, but it does make clear the unprecedented conditions that are occurring. Dane Wigington geoengineeringwatch.org U.S. is turning into an icebox this week. The record temps to prove it Source: Mashable An extreme weather pattern that began with a super typhoon in the Pacific Ocean is now gripping half of the United States with record-smashing cold. Essentially, the U.S. — from the Mid-Atlantic to the Gulf Coast, northward to the Canadian border, and all the way west to Portland, Oregon — has turned into an icebox. At the same time, record warmth has surged into Alaska and Northwest Canada, as the upper level weather highway known as the jet stream is diverted at least a thousand miles north of its usual position at this time of year, before plunging so far south over the U.S. that the air in Illinois is being sourced straight from Siberia. Here are some of the most noteworthy weather records set over the past few days. We’ll see more over the course of the next week, as at least one (perhaps two) more rounds of Arctic air invade the U.S. from our neighbor to the north. Minus-14 degrees Fahrenheit: In Denver, the temperature dropped to minus-14 degrees Fahrenheit on Thursday morning, tying for the second coldest all-time temperature recorded there in the month of November. The last time this happened was Nov. 27, 1887; the all-time record low there is minus-18 degrees Fahrenheit, set in 1877. The high temperature at Denver International Airport only reached 6 degrees Fahrenheit on Nov. 12, a record low maximum temperature for the date, beating the old record of 9 degrees, which was set in 1916. Robert Henson, a meteorologist at the University Corporation for Atmospheric Research in Boulder, Colo., posted on Facebook that in Denver’s recorded history of 142 Novembers, the only November days colder than Wednesday were in 1880 and 1919. Denver may see the first-ever streak of three November days with a high temperature below 20 degrees Fahrenheit, Henson added. Minus-27 degrees Fahrenheit: In Casper, Wyoming, the extremely low temperature on Wednesday evening set a daily record low as well as a monthly low. This beat the previous monthly record low of minus-21 degrees Fahrenheit, set on Nov. 23, 1985. These temperatures are about 50 degrees Fahrenheit below average for this time of year, and cold weather of this magnitude is typically experienced there beginning in December (if at all). The earliest Wyoming had reached such a cold temperature was on Dec. 5, 1972, the National Weather Service said. Climate data there dates back to 1939. Minus-21 degrees Fahrenheit: It was Livingston, Montana’s coldest temperature for so early in the season on Nov. 12. However, it has previously been much colder than this in November, with a reading of minus-31 degrees Fahrenheit on Nov. 13, 1959. 21 degrees Fahrenheit: On Nov. 12, Amarillo, Texas, set its coldest daily high temperature on record for so early in the season. 14 degrees Fahrenheit: On Nov. 12, Goodland, Kansas, set a record for the coldest daily high temperature for so early in the season. As the frigid airmass blows across the relatively warm waters of the Great Lakes, we’re likely going to see prodigious amounts of lake effect snow during the next week. As the Weather Prediction Center (WPC) put it in a forecast discussion on Thursday morning: A VERY PROLONGED PERIOD OF LOCAL LAKE-EFFECT SNOWFALL EVENTS WILL PREVAIL AT VARIOUS TIMES ACROSS ALL 5 GREAT LAKES. WITH SIGNIFICANT SNOWS ALREADY PRESENT…HARD TO IMAGINE HOW MUCH MORE SNOWFALL IS POSSIBLE…PROLIFIC? NUMBERS ARE POSSIBLE. ANOMALOUS? CERTAINLY. The warm side of this weather pattern: 50 degrees Fahrenheit: A record high temperature was set in King Salmon, Alaska, on Nov. 12. This beats the old record of 48 degrees Fahrenheit in 1986. The typical high temperature in King Salmon at this time of year is 31 degrees Fahrenheit. At least 41 degrees Fahrenheit: On Thursday, McGrath, Alaska, had already set a daily high temperature record as of 4:49 a.m. local time, at 41 degrees Fahrenheit. The actual high temperature will climb further during the day. McGrath will likely also set a record high minimum temperature record of 38 degrees Fahrenheit, which breaks the old record of 30 degrees from 2000. The cold air is going to spread all the way to the West Coast as well as the Southwest U.S. with time, and it will ooze into the Southeast, including Florida, as well, according to the WPC. Some models are suggesting that a snow event may take shape along the East Coast next week, but there is a lot of uncertainty regarding that scenario.The weather pattern is leading to a classic episode of what climate scientists have labeled the “warm Arctic, cold continents” pattern, something that has been seen with increasing frequency in recent years. Studies have tied this particular pattern in part to rapid Arctic climate change as a result of manmade global warming, although this is still a subject of debate within the mainstream climate science community. Source: Mashable
Global Extinction within one Human Lifetime as a Result of a Spreading Atmospheric Arctic Methane Heat wave and Surface Firestorm
Source: RobinWestenra @ Blogspot Abstract Although the sudden high rate Arctic methane increase at Svalbard in late 2010 data set applies to only a short time interval, similar sudden methane concentration peaks also occur at Barrow point and the effects of a major methane build-up has been observed using all the major scientific observation systems. Giant fountains/torches/plumes of methane entering the atmosphere up to 1 km across have been seen on the East Siberian Shelf. This methane eruption data is so consistent and aerially extensive that when combined with methane gas warming potentials, Permian extinction event temperatures and methane lifetime data it paints a frightening picture of the beginning of the now uncontrollable global warming induced destabilization of the subsea Arctic methane hydrates on the shelf and slope which started in late 2010. This process of methane release will accelerate exponentially, release huge quantities of methane into the atmosphere and lead to the demise of all life on earth before the middle of this century. Introduction The 1990 global atmospheric mean temperature is assumed to be 14.49 oC (Shakil, 2005; NASA, 2002; DATAWeb, 2012) which sets the 2 oC anomaly above which humanity will lose control of her ability to limit the effects of global warming on major climatic and environmental systems at 16.49 oC (IPCC, 2007). The major Permian extinction event temperature is 80 oF (26.66 oC) which is a temperature anomaly of 12.1766 oC above the 1990 global mean temperature of 14.49 oC (Wignall, 2009; Shakil, 2005). Results of Investigation Figure 1 shows a huge sudden atmospheric spike like increase in the concentration of atmospheric methane at Svalbard north of Norway in the Arctic reaching 2040 ppb (2.04 ppm)(ESRL/GMO, 2010 – Arctic – Methane – Emergency – Group.org). The cause of this sudden anomalous increase in the concentration of atmospheric methane at Svalbard has been seen on the East Siberian Arctic Shelf where a recent Russian – U.S. expedition has found widespread, continuous powerful methane seepages into the atmosphere from the subsea methane hydrates with the methane plumes (fountains or torches) up to 1 km across producing an atmospheric methane concentration 100 times higher than normal (Connor, 2011). Such high methane concentrations could produce local temperature anomalies of more than 50 oC at a conservative methane warming potential of 25. Figure 2 is derived from the Svalbard data in Figure 1 and the methane concentration data has been used to generate a Svalbard atmospheric temperature anomaly trend using a methane warming potential of 43.5 as an example. The huge sudden anomalous spike in atmospheric methane concentration in mid August, 2010 at Svalbard is clearly evident and the methane concentrations within this spike have been used to construct a series of radiating methane global warming temperature trends for the entire range of methane global warming potentials in Figure 3 from an assumed mean start temperature of -3.575 degrees Centigrade for Svalbard (see Figure 2) (Norwegian Polar Institute; 2011). Figure 3 shows a set of radiating Arctic atmospheric methane global warming temperature trends calculated from the steep methane atmospheric concentration gradient at Svalbard in 2010 (ESRL/GMO, 2010 – Arctic-Methane-Emergency-Group.org). The range of extinction temperature anomalies above the assumed 1990 mean atmospheric temperature of 14.49 oC (Shakil, 2005) are also shown on this diagram as well as the 80 oF (26.66 oC) major Permian extinction event temperature (Wignall, 2009). Sam Carana (pers. com. 7 Jan, 2012) has described large December 2011 (ESRL-NOAA data) warming anomalies which exceed 10 to 20 degrees centigrade and cover vast areas of the Arctic at times. In the centres of these regions, which appear to overlap the Gakkel Ridge and its bounding basins, the temperature anomalies may exceed 20 degrees centigrade. The temperature anomalies in this region of the Arctic for the period from September 8 2011 to October 7, 2011 were only about 4 degrees Centigrade above normal (Carana, pers. com. 2012). This data set can be seen on this site:- http://arctic-news.blogspot.com/p/arctic-temperatures.html Because the Svalbard methane concentration data suggests that the major spike in methane emissions began in late 2010 it has been assumed for calculation purposes that the 2010 temperature anomalies peaked at 4 degrees Centigrade and the 2011 anomalies at 20 degrees Centigrade in the Gakkel Ridge region. The assumed 20 degree Centigrade temperature anomaly trend from 2010 to 2011 in the Gakkel Ridge region requires a methane gas warming potential of about 1000 to generate it from the Svalbard methane atmospheric concentration spike data in 2010. Such high methane warming potentials could only be active over a very short time interval (less than 5.7 months) as shown when the long methane global warming potential lifetimes data from the IPCC (2007; 1992) and Dessus, Laponte and Treut (2008 ) are used to generate a global warming potential growth curve with a methane global warming potential of 100 with a lifespan of 5 years. Because of the high methane global warming potential (1000) of the 2011, 20 oC temperature anomalies in the Gakkel Ridge region, the entire methane global warming potential range from 5 to 1000 has been used to construct the radiating set of temperature trends shown in Figure 3. The 50, 100, 500 and 1000 methane global warming potential (GWP) trends are red and in bold. The choice of a high temperature methane peak with a global warming potential near 1000 is in fact very conservative because the 16 oC increase is assumed to occur over a year. The observed ESRL-NOAA Arctic temperature anomalies varied from 4 to 20 degrees over less than a month in 2011 (Sam Carana, pers. comm. 2012). Figure 4 shows the estimated lifetime of a globally spreading Arctic methane atmospheric veil for different methane global warming potentials with the minimum, mean and maximum lifetimes fixed with data from Dessus, Laponche and Treut (2008) and IPCC (2007, 1992). On this diagram it is evident that the maximum methane global warming potential temperature trend of 50 intersects the 2 degree centigrade temperature anomaly line in mid 2027 at which time humanity will completely lose our
Engineered “Polar Vortex” Freezes US
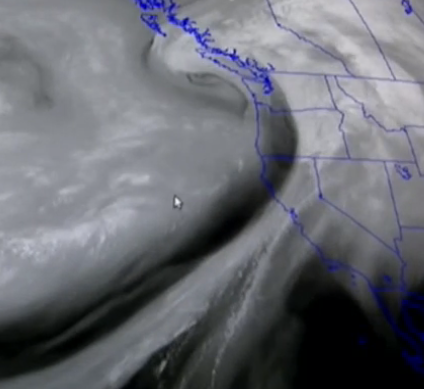
One of the best updates yet from the HAARP is below. I was actually on the US west coast near the Oregon border to witness the all out aerosol assault in the skies which is noted in the attached video. The sea temperatures were exceptionally warm, warm enough to swim in the waves for nearly a half hour with no wet suit. Historically this was not possible to do at any time of year in this location, let alone in mid November. A green sea turtle was recently caught of the coast of Oregon and tuna are being caught of the coast of Alaska, both instances are unprecedented. Global sea temperatures are now officially the warmest ever recorded. Why are the climate engineers working so hard to freeze the Eastern US? To continue the confusion and division amongst the population as to the true state of the climate. To demonstrate their power over the climate system. To hide the true gravity of what is unfolding on our planet for as long as possible while causing unimaginable harm to the biosphere in the process. Dane Wigington geoengineeringwatch.org.
Climate Engineering, Is It Working?

Dane Wigington geoengineeringwatch.org Is climate engineering cooling down our planet? Overall, absolutely not. If you live in the eastern half of the North American Continent, you may be very skeptical about the fact that our planet is warming at unprecedented speed, but it is important to remember that the eastern half of the lower US 48 states is only 1/2 of 1 % of the Earth’s surface area (.5%). Thats not much, and the world is much bigger. In addition, the massive all out climate engineering assault is radically stratifying the atmosphere which means that the geoengineers only have to create “cool” layer of air that sits on the surface (cold air is much more dense so it settles). Since the atmosphere is not mixing as it historically did, that cold layer creates much confusion and many “cold” headlines which is exactly what the climate engineers and the power structure wants. Completely engineered chemically ice nucleated storms help to create the cold layer just described. The climate engineers are cooling some regions down at the expense of completely contaminating the entire surface of the planet and worsening the overall warming.
‘Warmest year’ warning is issued

Source: Guernsey Press The UK is on course to experience the warmest and one of the wettest years since records began more than a century ago – sparking fears that future droughts and flash floods could cost lives.
The Most Dire Climate Assessment Ever Still Fails To Acknowledge Climate Engineering
Today, November 2nd, the largest scientific panel ever assembled on any subject in human history has issued the most dire warning yet on the state of the climate. This being said, the assessment still falls far short of stating how horrifically the climate is damaged and worse still the report does not say a word about the catastrophic and ongoing climate engineering programs. In our Orwellian world of total denial and omission the population is still completely oblivious to the fact that our biosphere is imploding. The global geoengineering assault is radically accelerating this planetary unraveling. Though the article below totally omits any mention of climate engineering, and is conservative in its still alarming conclusions, the data it does contain should be evaluated and considered. Dane Wigington geoengineeringwatch.org
Earth Cooking Up Record Temperatures

Source: Dallas News Earth is on pace to tie or even break the mark for the hottest year on record, federal meteorologists say. That’s because global heat records continued to be set in 2014, with September the latest example.
Arctic Ice Sixth Lowest In At Least A Thousand Years
The more people get over their disdain for Al Gore and begin to do honest investigation, the more they will be able to recognize well spun propaganda from Big Oil And The Geoengineers. Arctic ice is plummeting overall and the data to prove that is beyond any doubt or dispute. Extremely deceptive headlines are pumped out by powers who want to make the public believe all is well on our planet when the truth is anything but. Facts and figures are spun, distorted, or completely omitted in order to assemble a specific headline that sounds convincing to those that have not done a bit of objective research, unfortunately this includes most of the American population. If you want the truth, look at the facts. The article is the very latest data on the overall Arctic ice scenario. Dane Wigington Geoengineeringwatch.org