The Hottest ‘Hottest Year Ever’ Ever

Source: Motherboard Last year was the hottest year ever observed. "When averaged over the globe, 2014 was the warmest year on record," said Michael Freilich, the director of NASA's Earth Science division. He was speaking at a press conference, announcing that his agency and the National Oceanic and Atmospheric Administration (NOAA) had both independently determined that last year was the warmest ever recorded by human instruments. Earlier this month, Japan's Meteorological Agency did the same. Yet announcements like this roll out with disturbing regularity. Annually, almost, we see another year enter the record books for its incredible heat. According to scientists, as many as fourteen of the hottest years ever recorded have taken place in the 21st Century. 2012 was one of the 10 hottest ever recorded. 2011 was the ninth-hottest. And 2010 was the previous record-holder, the hottest year worldwide, ever recorded until that point. And it was in an incredibly close race with 2005.
Climate Science Is Built On A Foundation Of Lies And Omissions
Dane Wigington geoengineeringwatch.org Most would interpret the title of this article to mean that the planet is not warming as rapidly as we are being told, but the reality is this, planet Earth undergoing unprecedented and catastrophic warming. The 6 minute video at the bottom of this article is extremely revealing and alarming, but even the information in this video falls far short of conveying the true gravity and immediacy of what we collectively face. The "worst case" projections by "official government agencies" is for a 3 degree Celsius rise in temperatures by the end of the century, but such projections and modeling assume global geoengineering will work. This fact is astounding when all "official" agencies completely deny that geoengineering is even going on. All available data already makes clear the fact that the ongoing climate engineering programs are a total disaster. Climate intervention is making an already bad situation far worse, not better. In addition, "feedback loops" in the climate system like methane release are radically worsening an already dire climate scenario. Methane and its horrific effect on the greenhouse gas buildup are not even considered in IPCC climate models, how is this possible? What are the "scientists" being paid to hide? Methane is over 100 times more potent a greenhouse gas than Co2 over a 20 year time horizon. Because land and ocean temperatures are going up so rapidly, formerly frozen methane deposits are thawing and releasing. This factor is already pushing atmospheric methane levels off the charts. Methane is already rapidly building up in the atmosphere as the chart above clearly shows, but what are the temperature projections as the formerly frozen methane continues to thaw and release? The chart below should be alarming to all, it is the temperature rise projection for the Arctic, the rest of the world will not be far behind. The climate science community as a whole has radically underreported the severity of what we face. As conditions continue to unfold on the ground, the true degree of damage done to our planet and its life support systems will become impossible to deny. The total inadequacy of current climate modeling is clearly revealed in the six minute video below. Though climate engineering is not admitted to in this video, the data it contains is still valid. DW
Geoengineering, Record Low Arctic Ice And Catastrophic Drought, What’s The Connection?
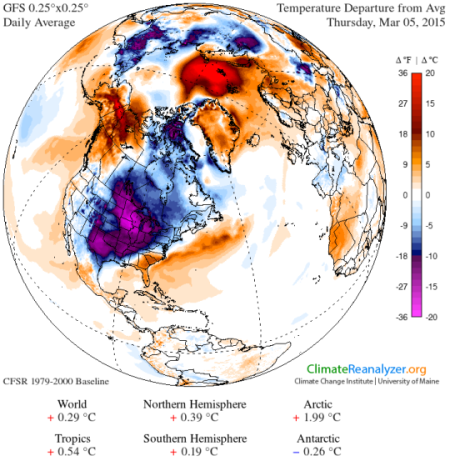
Dane Wigington geoengineeringwatch.org The climate engineers continue to orchestrate global weather patterns with catastrophic consequences. The US West has consistently been baked and dried into oblivion in order for the weather makers to create the headlines they want on the East coast, and also to hide news they don't want known in the Arctic. The NOAA map below shows what has become a typical (though historically unprecedented) pattern. The West experiences record heat, the East gets record cold. The record breaking heat in the West continues to intensify as the weather makers try to hide the imploding Arctic ice pack from public view. Those who have been lead to believe Arctic ice is expanding have been deceived. False headlines filled with false data by powerful interests with self serving agendas have been accepted as fact by many who don't want to believe global climate and environmental conditions are as bad as they are. Media is not mentioning that January 2014 through January 2015 were the warmest 12 months ever on planet Earth. The rapid warming is triggering "feedback" loops like methane release which is of grave concern. So what is the current state of Arctic ice? As of March 5th, 2015 Arctic Sea ice is at ALL TIME record low levels The graph above shows the normal increase of Arctic ice "extent" (surface area) during winter months. The now descending 2014/2015 blue line reflects the Arctic ice declining into record low territory at a time of year when it should still be expanding. What is the long term trend for Arctic ice volume? The graph below should be revealing. This image is assembled from the most scientifically accepted source of data on Arctic ice. The overall picture in regard to the state of the Arctic sea ice could not be more clear. The climate engineers have been pushing cold air south from the Arctic over and over (polar vortex) with constant jet stream manipulation. This is accomplished from constant aerosol spraying and the use of the global network of ionosphere heater facilities comparable to the HAARP installation shown below. The "ridiculously resilient ridge" of high pressure over the US West (which meteorologists cannot explain) is a part of the jet stream manipulation mentioned. What happens when the climate engineers rob cold air from the northern regions to create the headlines they desire in the Eastern US? The arctic then heats up. While engineered winter storms pile up record snow in Boston, Alaska doesn't have enough snow for the annual Iditerod sled race for the second year in a row and the Sierra snow pack is at record shattering lows. The "departure from normal high temperature" map below clearly shows the most anomalously cold zone in the entire world for the period from January 2014 through January 2015, the eastern half of the US lower 48. The Arctic and most of the rest of planet Earth is at far above normal high temperatures. What will the climate engineers do now that they have created enough of their desired "winter" headlines in the Eastern US? They will lock the colder air to the north in their attempt to slow the accelerating ice melt, this will bring a rapid heating back to most of the lower 48 states as the NOAA map below clearly shows. Note the NOAA maps "prediction" for a switch from the previous far above normal temperatures in Alaska (shown in the GISS global temperature map in this article) to below normal temperatures is a reflection of the "weather whack a mole" being carried on by the geoengineers. To accomplish this the US lower 48 will heat rapidly. Some of the spraying during the building of high pressure zones actually increases the UV radiation readings on the ground. Is a "lens effect" a goal of the climate engineers under certain circumstances? Are the climate engineers intentionally creating heat in some regions at some times in order to increase the strength of the high pressure zones which is used for jet stream manipulation. This appears not only possible, but likely. Though the geoengineers can create large scale temporary cool-downs, it comes at the cost of a worsened overall warming (overall global high temperatures continue to smash records). In addition, climate engineering continues to contaminate the entire planet and every breath we take. The Bottom Line The power structure and the climate engineers control our weather. To a large degree they decide how much rain will fall, and on whom. They can (and are) engineering snow storms. They decide how toxic that rain or snow will be, how toxic our air will be. They decide if our crops will succeed of fail. They decide who freezes and who fries. We are all living under a constant toxic heavy metal and chemical all out assault (which amounts to biological warfare) in addition to the ongoing weather warfare. We must all educate ourselves as much as possible, we must all share credible data with those around us and ask them to do the same. When we reach critical mass of awareness on this issue, the foundation of the power structure will crumble as populations around the globe realize they have all been willfully poisoned. Exposing and stopping climate engineering MUST be our top priority. DW https://dev.geoengineeringwatch.org/geoengineered-snow-storms-wreaking-havoc-around-the-globe-2/ http://arctic-news.blogspot.com/2015/03/march-4-2015-arctic-sea-ice-extent-hits-record-low.html http://www.zerohedge.com/news/2015-03-07/cruelest-winter-ever-californias-snowpack-drops-record-low http://www.huffingtonpost.com/2015/03/07/iditarod-show-goes-on-des_n_6822908.html https://dev.geoengineeringwatch.org/towing-the-line-for-big-oil-and-the-geoengineers/ http://www.ncdc.noaa.gov/sotc/summary-info/national/2015/2 http://thinkprogress.org/climate/2015/02/17/3623575/hottest-12-months-record/ http://www.cbsnews.com/news/arctic-sea-ice-thinning-dramatically-study-finds/ http://www.scpr.org/news/2015/03/05/50212/ridiculously-resilient-ridge-returns-redirects-rai/ https://robertscribbler.wordpress.com https://dev.geoengineeringwatch.org/engineered-winter-engineered-drought/
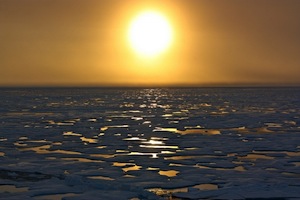
“Dramatic Thinning” — Arctic Sea Ice Enters Record Low Territory as Northern Polar Region Heats Up
Source: Robert Scribbler The Arctic sea ice is melting. It is melting far more rapidly than ever expected. This loss is measured in the form of square kilometers melted, in the form of ice thinned, in the form of new, blue water visible. Yet it is a loss beyond mere numbers and measures. A loss that has a profound impact to the Earth and its climate systems. Weather patterns, the rate of warming in the Arctic, the rate of tundra melt, seabed warming, and carbon store release. The rate of glacial loss in Greenland. All are impacted by sea ice loss and related ocean warming. And today, we mark another new record low. The most recent in a long series, with likely many more thinning ice days to come.
Arctic Sea Ice Is Getting Thinner Faster Than Expected
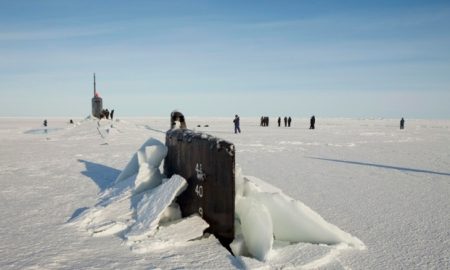
Source: The Guardian Study combining disparate data for first time finds sea ice thickness down 65% since 1975 because of global warming, reports Climate Central. While the steady disappearance of sea ice in the Arctic has been one of the hallmark effects of global warming, research shows it is not only covering less of the planet, but it’s also getting significantly thinner. That makes it more susceptible to melting, potentially altering local ecosystems, shipping routes and ocean and atmospheric patterns. New data compiled from a range of sources – from Navy submarines to satellites – suggests that thinning is happening much faster than models have estimated, according to a study aiming to link those disparate data sources for the first time. University of Washington researchers Ron Lindsay and Axel Schweiger calculated that in the central part of the Arctic Ocean basin, sea ice has thinned by 65% since 1975. During September, when the ice reaches its annual minimum, ice thickness is down by a stunning 85%.
Blaming Nature And Co2 For Engineered Drought

Mainstream media and the climate science community are blaming all of the rapidly increasing climate catastrophes around the globe on nature and Co2 with never so much as a single word mentioned about the climate engineering herd of elephants in the room. We live in truly astounding times, willful blindness and total denial of blatant obvious realities are the norm, not the exception. Those who pretend not to see the obvious realities are considered "normal", those who dare to tell the truth are considered to be fringe and out of balance. The unprecedented drought in California can conclusively be linked to the ongoing climate engineering/weather warfare being waged against the golden state. Saturating the atmosphere with particles creates too many condensation nuclei, this scatters and disperses moisture which reduces precipitation overall. Satellite images prove beyond any doubt that such atmospheric spraying is occurring constantly upstream from California in the storm track. Media and the climate science community is completely denying and ignoring this fact, this denial should be considered criminal by a population that is literally under assault. The constant spraying is also contaminating virtually every breath we take and the affects are cumulative. The article below correctly states the incredibly dire scenario now faced by Californians, the state is turning into a dust bowl. Again, what the article does not mention is the primary causal factor in this drought catastrophe, climate engineering. Dane Wigington geoengineeringwatch.org
Another Blow to Antarctic Glacial Stability as Larsen C Ice Shelf Cracks Up
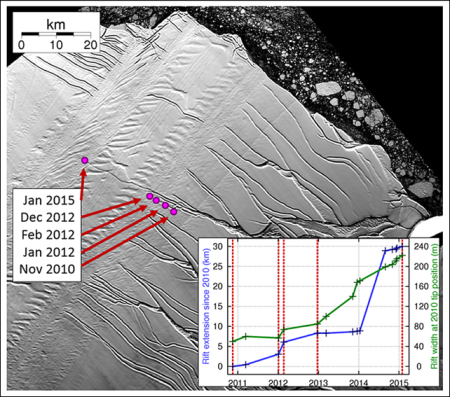
Source: Robert Scribbler (Northern edge of Larsen C Ice Shelf is at significant risk of breaking off as a massive rift continues to open within it. The above image shows the rate of rift propagation since November of 2010. Image source: Cryosphere Discussions.) There’s a 30 kilometer long and hundreds foot deep crack running through West Antarctica’s massive Larsen C ice shelf.
Climate Engineering And The Manipulated Perception Of The US Population
Dane Wigington geoengineeringwatch.org (Updated) If you live in the eastern half of the North American continent you may be convinced that the planet is actually cooling instead of warming even though 2014 is officially the warmest year ever recorded on Earth. If you live on the east coast of the US would you believe that January 2015 was the warmest January ever recorded in the Northern Hemisphere? It was.Those that have come to the conclusion that the whole planet is cooling should carefully examine the map image below. This is a GISS "departure from normal temperature" map for the entire 2014 year. What does this map reveal? The darker the colors, the further above normal the average temperatures were for the 2014 year. The light colors reflect departures from average to the below normal side. Where was the most consistent anomalous cold region on the entire planet for the 2014 year? The eastern half of the North American continent. How can this be when most of the world is far above normal temperatures? Climate engineering, is how. The engineered cooling of the Eastern US is very much a psychological operation. Most people cannot accept the possibility of a warm world if it is cold where they live. How short many people's memories are considering 2012 was the warmest year ever recorded in the continental US by far. In fact there were 362 all time record high temperatures set in the US during 2012, there were ZERO all time record lows. Why is it so important to know the facts in regard to the true state of the climate? Because spreading the "global cooling" propaganda is exactly what the power structure and the geoengineers want us to do. To push the "global cooling" myth is in effect helping the geoengineers sell climate engineering as an effective method of climate mitigation when in reality the exact opposite is true. Climate engineering is making the climate scenario far worse overall, not better. Worse still, the ongoing climate engineering fallout is contaminating the entire planet with toxic metal and chemical particulates.
Study Shows Global Sea Ice Diminishing, Despite Antarctic Gains
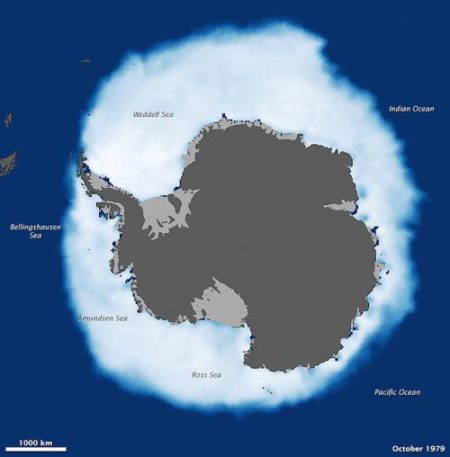
Source: Phys.org Comparing Arctic sea ice loss to Antarctic sea ice gain shows that the planet has-been shedding sea ice at an average annual rate of 13,500 square miles since 1979, the equivalent of losing an area of sea ice larger than the state of Maryland every year. Credit: NASA's Earth Observatory/Joshua Stevens and Jesse Allen Sea ice increases in Antarctica do not make up for the accelerated Arctic sea ice loss of the last decades, a new NASA study finds. As a whole, the planet has been shedding sea ice at an average annual rate of 13,500 square miles (35,000 square kilometers) since 1979, the equivalent of losing an area of sea ice larger than the state of Maryland every year.
Is The Whole Solar System Warming? No
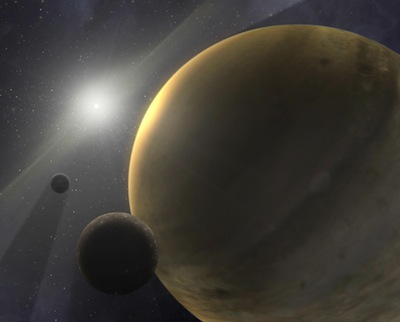
Many claim that the whole solar system is warming, but is this really the case? What does available science tell us about this conclusion? I have had many make this claim to me, but none have yet been able to offer a single bit of science to substantiate the "whole solar system is warming" claim. So what does the science say? Dane Wigington geoengineeringwatch.org