California Continues to Shatter Temperature Records
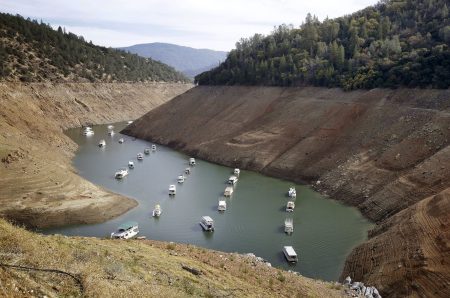
Source: Climate Central The dubious records keep piling up for California, a state wracked by four years of drought brought on by a pernicious weather pattern that has kept rains at bay and exacerbated by human-induced warming. Just one week after the state measured its lowest-ever snowpack, U.S. scientists have announced that the year so far has been the warmest on record, setting expectations for a long, hot, dry year ahead. “2015 to date has been truly astonishingly warm in California, and we're breaking almost all the temperature records there are to break,” Daniel Swain, an atmospheric science PhD student at Stanford University, said in an email. A time series of California annual temperatures, with an arrow pointing to the incredible heat of the past few years. Click image to enlarge. Credit: NOAA
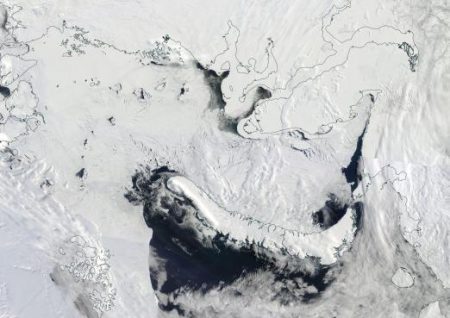
Arctic Sea Ice At Record Low On April 9 2015
Source: Arctic News On April 9, 2015, Arctic sea ice extent was only 14.051 square km, a record low for the time of the year, as illustrated by the image below. Temperature anomalies at the top end of the scale (20°C, or 36°F) are hitting the Arctic Ocean in many places, as illustrated by the forecast below, showing an overall anomaly of +3.19°C for the Arctic for April 11, 2015, despite low temperatures over Greenland.
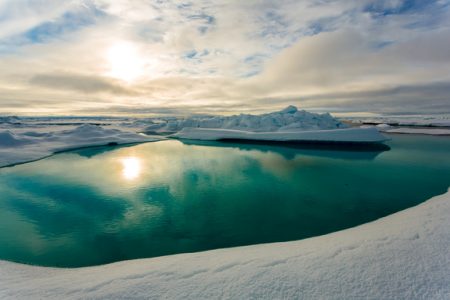
At Start of 2015 Melt Season, Arctic Sea Ice is in a Terrible State
Source: Robert Scribbler Strong Polar Amplification. With human-forced climate change, it’s normally something you’d tend to see during winter time. By spring, the increase in solar radiation in the Mid-Latitudes would tend to force a more rapid pace of warming there. The snow and ice cover, recently refreshed by winter, would be at highest annual albedo at winter’s end. That high albedo would create a warming lag from the upper Latitudes. The resulting increase in temperature differential would then tend to reinforce the Jet Stream — giving it a strengthening kick and providing the polar north with a kind of ephemeral haven. At least for a brief window during early spring time. Not so with 2015. This Spring, the Jet has been a basketcase. A mess of meanders like a river finding its way through a wetland prior to joining the sea. Strong south to north flows have persisted over the North Atlantic and well into Western Siberia. These meridional patterns have repeatedly delivered heat into the Arctic — particularly through the oceanic gateway between Greenland and the Yamal region of Russia.
Antarctica May Have Just Set Its Highest Temperature On Record
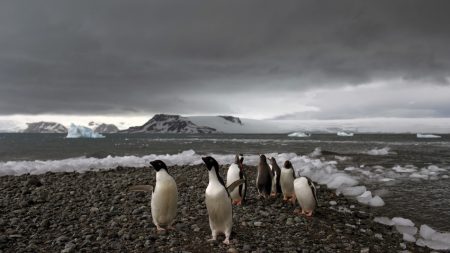
Source: Mashable, written by Andrew Freedman Antarctica, Earth's coldest, most barren continent, may have just set a remarkably unusual weather record. An Argentinian research station on the rapidly warming Antarctic Peninsula recorded a high temperature of 63.5 degrees Fahrenheit (17.5 degrees Celsius) on March 24, according to reports from Weather Underground. If this is investigated and verified by the World Meteorological Organization (WMO), it could become the highest temperature on record for the entire continent of Antarctica. The warmth at the Esperanza research station came one day after a nearly identical high temperature was logged at another Argentinean base, known as Base Marambio, also located along the Antarctic Peninsula. Interestingly, the mild conditions occurred during the Antarctic fall, not the height of summer.
Antarctica’s Ice Shelves Thin, Threaten Significant Sea Level Rise
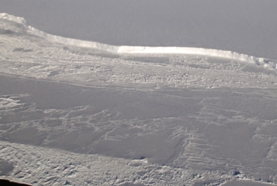
Source: Scientific American, by Andrea Thompson and Climate Central Giant doorstops of ice are melting away Over the past two decades, the massive platforms of floating ice that dot the coast of Antarctica have been thinning and doing so at an increasing rate, likely at least in part because of global warming. Scientists are worried about its implications for significant sea level rise. The ice shelves—some of which are larger than California and tens to hundreds of yards thick—are the linchpins of the Antarctic ice sheet system, holding back the millions of cubic miles of ice contained in the glaciers that flow into them, like doorstops. As the ice sheets thin, the massive rivers of ice behind them can surge forward into the sea. Antarctica holds enough ice, if it all melted, to raise sea levels more than 200 feet. That would take hundreds to thousands of years, but the recent thinning of the ice shelves means that there has already been an increase in the rate of Antarctica’s contribution to sea level rise, and it’s accelerating.
Are The Climate Engineers Attempting To Shut Down The Gulf Stream?
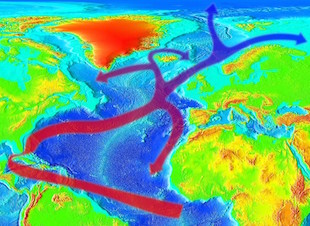
Dane Wigington geoengineeringwatch.org Remember the movie "The Day After Tomorrow"? The 5 minute video below is a prelude for the article which follows. Is it possible that the global power structure is desperate enough and insane enough to attempt to slow or shutdown the thermohaline circulation? Could this be an effort to slow the rapid warming of our planet by attempting to reduce the catastrophic thawing of methane on the seabed of the Arctic (which is a risk to all life on Earth) by cutting off the flow of warm ocean currents to that region? It is impossible to know the answer to this question, but if a shutdown of the thermohaline occurs (whatever the cause or causes), it will come with yet more dire consequences to the climate. If the thermohaline does drastically slow or collapse, it will only make an already bad climate scenario far worse still.
NOAA “Scheduled Weather” Map, Alarming Forecast
Dane Wigington geoengineeringwatch.org If the NOAA map below does not shock you, it should. Raytheon supplies weather modeling for NOAA (National Oceanic and Atmospheric Administration) and the National Weather Service. Raytheon is a major player with the ongoing climate engineering. The facts just mentioned add up to this, maps like the one below represent nothing less than the "scheduled weather". Global weather systems are completely manipulated and have been for a very long time. How far can the weather makers force the Earth's climate and life support systems to achieve their own agendas? How much more can the planet take? If climate engineering is not exposed and halted very soon, the consequences of these programs will eventually be total. The "forecast" map below shows departure from normal high temperatures (2-3 degrees for each color shade either above or below normal depending on the color shade). If the "scheduled" weather on this "forecast" map comes to pass, there will be record shattering high temperatures all over the Western US and Alaska while the US East will continue with engineered storms and record cold temperatures. This map shows what geoengineering is doing to our planet with shocking clarity, it should be contemplated and considered. The map below is the most alarming NOAA map of the US I have ever seen, the engineered extremes keep getting worse. The responsibility of exposing climate engineering rests on us all, make every day count in this fight. Each color shade generally represents about 2-3 degrees of temperature departure from "normal" (above or below depending on the shade)
Scientists Say Arctic Sea Ice Just Set A Disturbing New Record
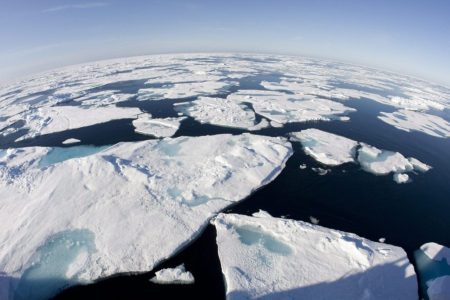
Source: Washington Post, written by Chris Mooney Two weeks ago, we noted here that the Arctic was on the verge of a scary new record — an unprecedented “lowest winter maximum” for sea ice extent. What that would mean is that during the season of the year when there is the most ice covering the seas of the Arctic, the peak extent of that ice was nonetheless smaller than in any year – at least since satellite measurements began in the late 1970s. And now, the Boulder-based National Snow and Ice Data Center (NSIDC), which tracks sea ice, has indeed announced that the peak winter Arctic sea ice extent “likely” occurred Feb. 25, and that this maximum “not only occurred early; it is also the lowest in the satellite record.” However, the agency does include several caveats. That includes not only the word “likely,” but also the observation that “a late season surge in ice growth is still possible.” The loss of sea ice around the Arctic has a vast number of consequences. They range from climatic — exposing more dark ocean water, which absorbs more solar radiation than ice does, leading to further warming — to social and cultural: Undermining the subsistence hunting techniques that Alaskan native villages have pursued atop the ice for generations.
NASA: Earth Tops Hottest 12 Months On Record Again, Thanks To Warm February
Source: ThinkProgress.org There had never been as hot a 12-month period in NASA’s database as February 2014–January 2015. But that turned out to be a very short-lived record. NASA reported this weekend that last month was the second-hottest February on record, which now makes March 2014–February 2015 the hottest 12 months on record. This is using a 12-month moving average, so we can “see the march of temperature change over time,” rather than just once every calendar year. We are experiencing the continuation of the global warming trend that made 2014 the hottest calendar year on record. The very latest science says we should expect an acceleration in surface temperature warming to start quite soon. What is happening now is consistent with that.
Engineering A World Of Climate Extremes

Dane Wigington geoengineeringwatch.org If the map below does not look terribly out of balance to you, it should. The all out effort to engineer constant cool-downs in the eastern US could not be more obvious and is still being carried out in order to manufacture the media headlines necessary to continue the confusion and division of the US population in regard to the true state of the global climate. The latest GISS map below shows "departure from normal temperatures" for the month of February 2015. Where is the ONLY anomalously cold place in the whole world (yet again)? As has been the case for a very long time already, it's the eastern half of the US lower 48 states. Now the climate engineers have reached their goal of creating the all time snow record for Boston and that is what mainstream media is spending most of their time talking about. The same overall pattern continues for the US, the West bakes, the East freezes. In between engineered cool-downs in many regions there is a constant extreme weather whiplash occurring. Temperatures swing radically from the engineered record cold events, to record warm, and then back to record cold as the next engineered cool-down is orchestrated.