Ancient Andes Glaciers Have Lost Half Their Ice In Just 40 Years
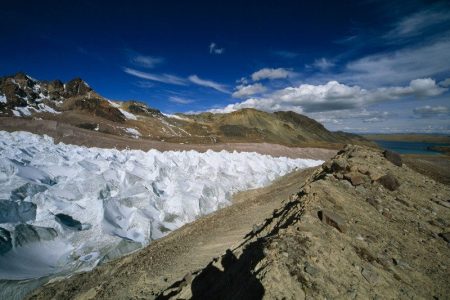
Source: New Scientist By Chelsea Whyte The snowcapped skyline of the Andes is beating a hasty retreat. Since the mid-1970s, the area covered by glaciers in Peru’s Cordillera de Vilcanota range has nearly halved, with most losses occurring below 5000 metres. Using Landsat images taken every decade, glaciologists at the Federal University of Rio Grande do Sul in Brazil measured the snowline of the southern Peruvian range and found the ice caps that feed the glaciers shrinking. Overall, they found that 48 per cent of ice had disappeared since 1975, with 81 per cent vanishing in areas below 5000 metres. As global warming continues, such tropical glaciers are likely to disappear. Losses are occurring at different speeds on either side of the mountain range. “In general, the western sides of the tropical Andes maintain cold and dry conditions, whereas the eastern sides are humid and warm,” says Bijeesh Veettil, who led the study.
As Arctic Ocean Ice Disappears, The Global Climate Impacts Intensify
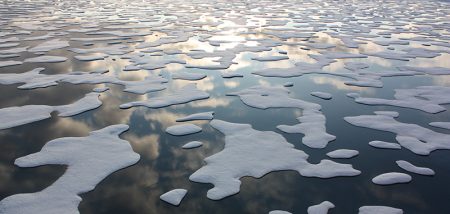
Source: Yale – Environment 360 The top of the world is turning from white to blue in summer as the ice that has long covered the north polar seas melts away. This monumental change is triggering a cascade of effects that will amplify global warming and could destabilize the global climate system. BY PETER WADHAMS The news last week that summer ice covering the Arctic Ocean was tied for the second-lowest extent on record is a sobering reminder that the planet is swiftly heading toward a largely ice-free Arctic in the warmer months, possibly as early as 2020. After that, we can expect the ice-free period in the Arctic basin to expand to three to four months a year, and eventually to five months or more. Since my days measuring the thickness of Arctic Ocean ice from British nuclear submarines in the early 1970s, I have witnessed a stunning decline in the sea ice covering the northern polar regions — a more than 50 percent drop in extent in summer, and an even steeper reduction in ice volume. Just a few decades ago, ice 10 to 12 feet thick covered the North Pole, with sub-surface ice ridges in some parts of the Arctic extending down to 150 feet. Now, that ice is long gone, while the total volume of Arctic sea ice in late summer has declined, according to two estimates, by 75 percent in half a century. The great white cap that once covered the top of the world is now turning blue — a change that represents humanity’s most dramatic step in reshaping the face of our planet. And with the steady disappearance of the polar ice cover, we are losing a vast air conditioning system that has helped regulate and stabilize earth’s climate system for thousands of years.
Sea Ice Record Retreat Has Antarctic Experts Worried For Wildlife, Climate
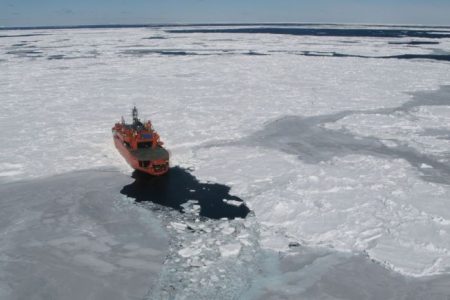
Source: Australian Broadcasting Corp. Scientists fear a sharp reduction in Antarctic sea ice in recent weeks will impact marine life and climate systems. Key points Antarctic sea ice retreating earlier than usual Instability of ice affecting access to research stations Impacts expected on marine life, climate, research New daily records have been set for measuring the retreat of sea ice around Antarctica in the past week. The sea ice reached a record high in 2014, when it exceeded 20 million square kilometres. Aurora Australis moving through sea ice This year the sea ice peaked at 18.5 million square kilometres on August 28 — close to the lowest winter level on record.
Snowstorms And Raging Wildfires In The Same Region On The Same Day, Welcome To Geoengineering
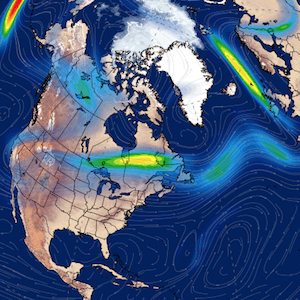
Dane Wigington geoengineeringwatch.org The Climate engineers are increasingly desperate to hide the accelerating planetary meltdown with short term chemically nucleated cool-downs. Engineered cool-downs have been a major component of the climate engineering assault for many decades. The chemical cool-downs create the headlines the power structure needs to continue the population's confusion and division in regard to the true state of the climate. Yellowstone National Park is the latest example of chemically ice nucleated deception. The photo above was taken in Yellowstone National Park on Monday, September 12, 2016. Photo credit: Devon Hannan The Yellowstone event is not unique, a chemically nucleated "snowstorm" in South Dakota that occurred on October 4th of 2013 killed up to 100,000 cattle. This event occured while it was 85 degrees and raining in Chicago and 89 degrees with rain in Kansas City.Other anamolous cool-down chemically nucleated events in South America may have been responsible for the death of up to 200,000 alpacas. On Monday, September 12th, 2016 (the same day that the snowstorm photo above was taken), the south entrance to Yellowstone park was closed due to an ongoing out of control wildfire (as shown in the photo below). Again, this wildfire was raging on the same day (and at the same time), that other parts of Yellowstone Park were experiencing a summer snowstorm. Liquid precipitation can be chemically converted to frozen precipitation under a variety of conditions when there is enough moisture present and a large enough geoengineering operation deployed. The Chinese openly announced the fact that they were chemically nucleating snowstorms until they did a billion dollars worth of damage to Beijing. Radar map multi-hour loops can be revealing in regard to chemical ice nucleation process. Migrating bands of precipitation can often be seen "flashing out" to frozen precipitation with no elevation change on the topography below the storm/precipitation. Do US temperature maps for September 12, 2016, indicate conditions are present that would facilitate such a summer snowstorm? NO. The map above is for Monday, September 12, 2016, the same day as the snowstorm in Yellowstone. Above normal temperatures are, again, returning to the Yellowstone region and are predicted to peak by Sunday, September 18th, 2016. The very rapid rebound of high temperatures is a glaring red flag as to the engineered nature of the Yellowstone "summer snowstorm". Weather "whiplash" is becoming the norm. As previously mentioned, the engineered cool-downs are a means of confusing and dividing the population as to the true state of the global climate. Though climate engineering can create the temporary toxic cool-downs, they come at the cost of an even worse overall warming. How warm is our planet? This is not about Al Gore and carbon credit scams, it is about reality. July 2016 was the 15th consecutive month of all time record high temperature months. August, 2016, just broke the record again. Records are being shattered in spite of wide spread UNDER REPORTING of official high temperatures. The animation above clearly shows the trend of rapidly rising temperatures on planet Earth. Geoengineering, and its endless list of negative consequences, is making an already dire global climate scenario worse overall, not better. Does the long term forecast call for "cooler than normal" temperatures for the US (including Alaska)? Again, the answer is NO. The rapidly increasing orange and red zones (all reflecting above normal and far above normal temperatures) on US "departure from normal temperature" forecast maps should be extremely alarming to all of us. Are global land and temperatures cooling? NO The planet may well be in a runaway greenhouse event already with climate engineering helping to fuel the overall fire. The biosphere was in a cooling phase until the start of the industrial revolution. The two level periods of temperatures in the historical graph below were due to the climate forcing effect of aerosols loading/saturation of the atmosphere. The toxic tug of war between increasing greenhouse gases and atmospheric aerosols (with geoengineering adding to the aerosol loading since the mid 1940s) is wreaking havoc on the climate system. On a longer timescale, the impact of anthropogenic activity (which includes geoengineering) can clearly be seen. The long term cooling trend on the planet turned to an abrupt climate shift toward extremely rapid heating. On an even longer scale, the total disruption of Earth's normal and natural cyclical pattern is shockingly visible On a time scale of this duration, the heating up of our planet appears as a straight up vertical trajectory at the far right of the graph. Arctic sea ice is one of the most measurable and visible harbingers of our rapidly changing planet. Headlines of Arctic ice expansion are patently false as are headlines of global glacier expansion. Though Arctic sea ice is imploding, the use of chemical ice nucleation is being heavily utilized in the desperate attempt to keep the headline from full public veiw for as long as possible. The Greenland ice sheet is also rapidly melting. To deny the unfoding planetary meltdown is simply to toe the line for big oil and the geoengineers, public ignorance and denial of the front line reality is what they want. The climate engineers have used climate modification as a weapon of war, nothing less. In their attempt to manipulate the planet's life support systems for their own agendas, the overall warming has been accelerated due to the endless list of climate engineering consequences. The 30 second video below illistrates the melt rate of Arctic sea ice. From ozone layer destruction, to devastating drought, to fueling wildfires, geoengineering/weather warfare programs are wreaking havoc around the globe. Though the US military has just admitted on the record (again) that the disintagrating climate is a massive national security risk, what they won't admit to is that they (and the global geoengineering programs they are a part of) are a huge factor further forcing the disintagration to begin with. Climate engineering is nothing short of a covert weapon to control populations at the expense of the entire web of life. If we are to salvage what is left of the planet's life support systems, the climate engineering insanity must be exposed and halted.
Climate Trackers Say August Was Record-Warm Globally
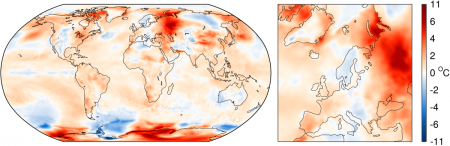
Source: Summit County Citizens Voice Staff Report August 2016 is down in the global climate annals as the warmest August on record and the second-warmest month of all time, just behind July. According to Copernicus, Europe’s earth observation program, August’s global average temperature was 0.62 degrees Celsius above the 1981-2010 average, and 0.17 degrees Celsius warmer than the previous August record, set in 2015. According to the Copernicus update, the global temperature anomaly crested in February, coinciding with the peak of ocean-warming El Niño conditions, dropped from March to June, but spiked again during July and August. Each month from August 2015 onward has been the warmest on record for that particular month. Across Europe, temperatures varied from month to month, from well-above average in December 2015 to below average in January, then back to warmer than average in February, with each subsequent month through August remaining above average.
‘Next Year Or The Year After, The Arctic Will Be Free Of Ice’
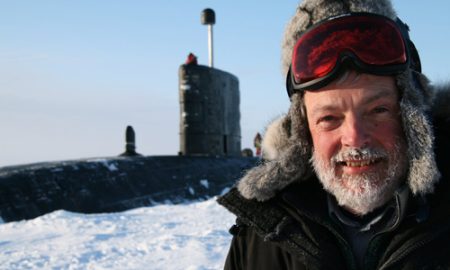
Source: The Guardian Scientist Peter Wadhams believes the summer ice cover at the north pole is about to disappear, triggering even more rapid global warming. Peter Wadhams has spent his career in the Arctic, making more than 50 trips there, some in submarines under the polar ice. He is credited with being one of the first scientists to show that the thick icecap that once covered the Arctic ocean was beginning to thin and shrink. He was director of the Scott Polar Institute in Cambridge from 1987 to 1992 and professor of ocean physics at Cambridge since 2001. His book, A Farewell to Ice, tells the story of his unravelling of this alarming trend and describes what the consequences for our planet will be if Arctic ice continues to disappear at its current rate. You have said on several occasions that summer Arctic sea ice would disappear by the middle of this decade. It hasn’t. Are you being alarmist? No. There is a clear trend down to zero for summer cover. However, each year chance events can give a boost to ice cover or take some away. The overall trend is a very strong downward one, however. Most people expect this year will see a record low in the Arctic’s summer sea-ice cover. Next year or the year after that, I think it will be free of ice in summer and by that I mean the central Arctic will be ice-free. You will be able to cross over the north pole by ship. There will still be about a million square kilometres of ice in the Arctic in summer but it will be packed into various nooks and crannies along the Northwest Passage and along bits of the Canadian coastline. Ice-free means the central basin of the Arctic will be ice-free and I think that that is going to happen in summer 2017 or 2018.
Arctic Sea Ice Is Vanishing Far Faster Than Anyone Thought Possible
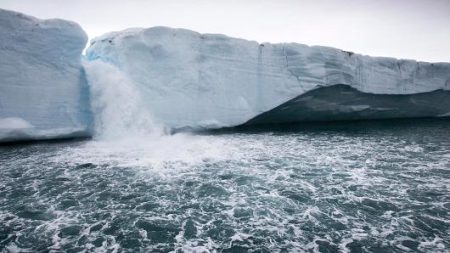
Source: CNBC, article by Robert Ferris Arctic sea ice is melting at a rate far faster than anyone thought, and it is already wildly, and perhaps permanently, changing the region, and the planet. Historically, sea ice forms every winter across the top of the planet, and covers much of the Arctic Ocean. Every summer, the ice melts a bit and retreats, only to repeat the cycle again. But since the 1980s, the ice has been retreating further and further overall, contributing to sea level rise, changes to ecosystems, and erosion so severe it is biting off chunks of coastlines in Alaska, Canada and elsewhere. As 2016 continues apace to be one of the warmest years on record, Arctic sea ice levels appear to be among the lowest on record, said Tom Wagner, program manager for NASA's cryosphere research — a name given to the study of frozen regions of the planet. "It doesn't look like the ice is healing or growing back."
July 2016 Was World’s Hottest Month Since Records Began, Says NASA

Source: The Guardian Nasa’s results, which combine sea-surface temperature and air temperature on land, show July was 10th month in a row to break monthly temperature record Last month was the hottest month in recorded history, beating the record set just 12 months before and continuing the long string of monthly records, according to the latest Nasa data. The past nine months have set temperature records for their respective months and the trend continued this month to make 10 in a row, according to Nasa. July broke the absolute record for hottest month since records began in 1880. Similar data from the US National Oceanographic and Atmospheric Administration (Noaa) said the past 14 months have broken the temperature record for each month, but it hasn’t released its figures for July yet. The new results were published on the Nasa database and tweeted by climatologist Gavin Schmidt, director of the Nasa Goddard Institute for Space Studies.
Climate Scientists Are Now Relying On A Terrifying Assumption

Source: The Week How can we solve climate change? One option is obvious, if a bit strange: If dumping carbon dioxide into the atmosphere is the problem, then we could always suck it back out. If you think that sounds tricky, congratulations, you're correct. However, scientists are increasingly relying on just this idea to construct workable future scenarios where global warming does not spin out of control. And the reason is that governments around the world have not been remotely equal to the task of keeping overall warming below 2 degrees Celsius, the level at which climate change becomes unacceptably risky according to the international Paris climate accords. As a result, scientists crunching the numbers on how humanity might achieve this goal are increasingly leaning on outlandish assumptions about pulling billions of tons of carbon dioxide out of the atmosphere. The math checks out — but the science is not guaranteed to work, and it would be a lot easier to just implement proper climate policy right now.
The Melting Of The Arctic Ice Continues Apace
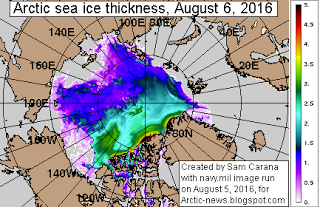
Source: Seemorerocks Some thoughts of my own on the melting sea ice in the Arctic and on recent headlines. Sam Carana has given an update on the Arctic ice in his latest article, Arctic Sea Ice Getting Terribly Thin Now I would like to give my own perspective as a relatively-informed lay person. This is how I see it. Mostly what we get through media reports is the sea ice area. If we look at the graph below we are due to beat the record for sea ice extent set in 2012. This makes the situation look pretty pretty bad, but not dire.