Source: Discover Magazine

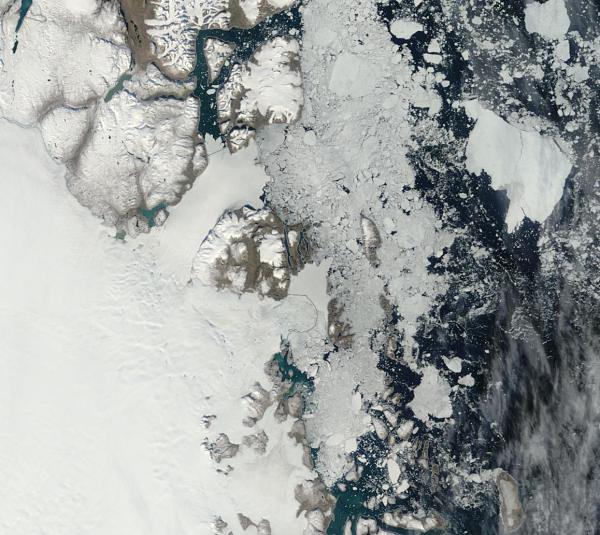
This animation consists of false-color images of the Russian coast and adjoining East Siberian Sea acquired by NASA’s Aqua satellite. On June 18, the offshore waters were choked with sea ice. By July 6, 2017, a lot of it had broken up. In the false-color scheme, land is green, black is indicative of open water, and ice is a light turquoise. The darker blue prominent in the June 18th image probably is indicative of melting snow and ice that’s causing liquid water to accumulate. (Images: NASA Worldview. Animation: Tom Yulsman)
Under frigid winter conditions, the Arctic’s floating lid of sea ice typically expands to a maximum extent in March. But thanks to human-caused global warming, that maximum seasonal spread of the ice has been shrinking over the years — and this past March it reached the lowest level ever observed for the month.
But then, something unexpected happened: In May, sea ice retreated much more sluggishly.
This prompted some people who deny the reality of humankind’s impact on the climate to pounce. “ARCTIC SEA ICE BOUNCES BACK,” shouted one headline (on a blog that bills itself as being dedicated to “common sense on climate change”). Well, hold on…
Now we have the latest monthly report from the scientists at the National Snow and Ice Data Center, and wouldn’t you know it: During June, Arctic sea ice shrank faster than average. That resulted in June’s ice cover coming in at sixth lowest in the satellite monitoring era, which began in 1979.
But that’s not the most newsworthy part of the report. In my view, this is: By July 2, Arctic sea ice had retreated to a particularly low level matching what was seen on the same date in 2012.
That’s significant because in 2012, sea ice went on to set a record that has not been broken since. During the summer of that year, ice extent dropped precipitously, and in September it went lower than ever seen before.

A comparison of true-color and false-color images acquired by the Aqua satellite on June 18, 2017 in the same area as shown in the animation at the top of this post. Note the likely melt ponds, which contribute to the break up of sea ice. (Images: NASA Worldview. Animation: Tom Yulsman)
Of course, just because Arctic sea ice melted relatively fast in June and is really low now doesn’t mean it will set a new record this coming September. But given the conditions in the Arctic right now, the odds are good that the sea ice extent minimum will be very low.
How low? It’s impossible to know for sure at this point. But scientists of the Sea Ice Prediction Network do their best to make informal forecasts. For their June report, they analyzed predictions from 33 different sources. According to the report, the median forecast is for Arctic sea ice extent to bottom out in September at 4.43 million square kilometers. That would put it in the top five of lowest extents on record.
That relatively low number probably reflects a number of factors. One is temperature — specifically, how cold has it been in the Arctic and for how long?
This is gauged by something called cumulative freezing degree days. This is the sum of daily mean temperatures below freezing over a particular period.
Based on this metric, between July of last summer and July of this year, the Arctic has been “extremely mild,” according to the NSIDC report. Do keep in mind that this is a relative statement. It is a specific comparison to a base period of 1981 to 2000.
You can see just how relatively mild it has been by clicking on the graphic above. From July of 2016 to now, the period has been milder than the same period in 2012, the year Arctic sea ice hit its lowest extent on record.
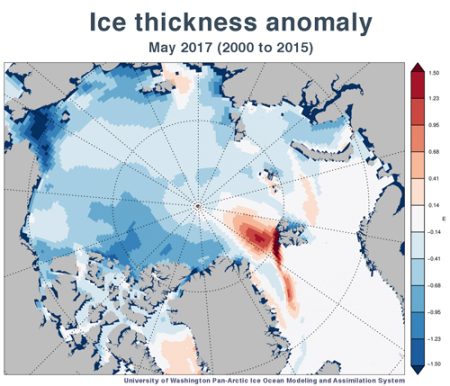
The relative dearth of days with below freezing temperatures has taken a toll on the sea ice. Across the Arctic, it is thinner than average, according to an analysis by the University of Washington’s Pan-Arctic Ice Ocean Modeling and Assimilation System, or PIOMAS.
The image above shows what’s happening. Areas in blue indicate areas where Arctic sea ice is thinner than the 2000 to 2015 average. And as the graphic shows, sea ice thicknesses for May 2017 were below average over most of the Arctic Ocean. (The exception: the red areas north and west of the Svalbard archipelago.)
The scrawny ice cover will make it easier for warm summer temperatures to melt the ice. As the June NSIDC report states, “Starting the melt season with below-average ice thickness raises the likelihood of having especially low September ice extent.”
Time will tell.
Source: Discover Magazine


