Source: Robert Scribbler
Under an oppressive human fossil fuel emission, the world just keeps getting hotter and hotter, the 2015-2016 El Nino just keeps looking ever more monstrous, and reports of tragic, heat-related, mass casualty events just keep rolling in.
* * * *
JULY 21, 2015: All the major climate monitors have now chimed in — NASA, Japan’s Meteorological Agency, NOAA. And June of 2015 is now marked as the hottest recorded in every single one. But of these, the NOAA measure, which provided its Global Analysis report yesterday, clearly is the starkest.
Showing extraordinary warming, June of 2015, according to NOAA, hit +0.88 C above the 20th Century average. That’s an excessive leap of +0.12 C over last year’s previous record June measure showing a +0.76 C global temperature departure and just 0.02 C behind the all-time monthly record values for any month hit just this year during February and March (+0.90 C). When compared to 1880s averages, June was fully 1.08 C hotter. That’s more than halfway to the (not safe) 2 C threshold which IPCC has marked off as the point where catastrophic impacts from human caused climate change really start to hit high gear.
(On the up ramp to a hothouse. The NOAA global climate record for land and ocean temperatures over the last 136 years in which June of 2015 is now the all-time hottest. Image source: NOAA.)
We can clearly see the progress of rapid warming over the past 136 years in the above graph. Particularly since 1980 — when global temperatures really started to hit a rapid ramp up. Note that the mythological pause is not at all evident in the above graph. Global temperatures through June measures just kept driving on — higher and higher.
Back to Back Record Years on the Way — The Human Warming Escalator and The El Nino Jump
With all the June measures coming in so strongly on the hot side, and with the first half of this year already substantially warmer than the previous record warm year of 2014, it appears that we are locking in for back-to-back years of record heat. These new records are occurring in the context both of the larger, human-forced warming trend and as we hit the warm end of the global natural variability scale — El Nino.
It’s important to remember that the driver of these new records is the underlying accumulation of greenhouse gasses in the atmosphere. Deke Arndt, chief of the monitoring branch of NOAA’s National Centers for Environmental Information (NCEI), noted at a press conference last month:
“Climate change is a long-term driver, so that’s like standing on an escalator as it goes up. So, the longer that we go into history, we’re riding up the escalator. And now that we’re getting an El Niño event, we happen to be jumping up at the same time, and so they play together to produce outcomes like what is likely to be the warmest year on record.”
And propelled by that human warming escalator, the current El Nino jump is starting to look absolutely savage.
El Nino Just Keeps Growing Stronger
For today’s Australia Bureau of Meteorology (BoM) report showed the current El Nino striking down yet another 1997 record. According to BoM findings, all key Nino ocean zones have shown surface temperatures in excess of 1 C above average for 10 successive weeks. This shatters the previous record duration for such an event — occurring in 1997 at 8 weeks in length. Notably, the current record heat build for Nino zones is still ongoing. So the new, 2015 record could extend further.
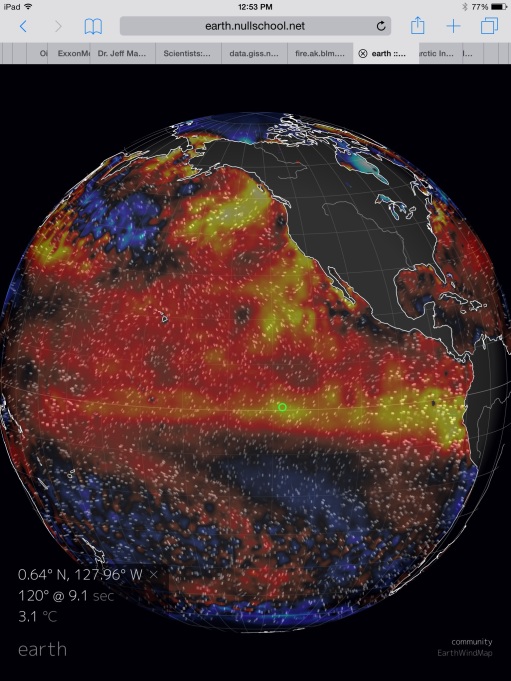
Overall, BoM shows the entire Eastern Equatorial Pacific now at +2 C. To get an idea what this looks like, we can take a peek at the Earth Nullschool sea surface temperature anomaly measure:
(The entire Northern, Eastern and Equatorial Pacific is exceedingly hot — showing anomalies in the +1 to +4 C range practically everywhere. Meanwhile, temperatures in the Central Pacific are starting to approach Super El Nino ranges. Image source: Earth Nullschool.)
Taking in this shot, it’s worth pausing for a moment to appreciate the fact that not only is the Equatorial Pacific outrageously hot, the entire Northern and Eastern Pacific from the Arctic on south is just off-the-charts hot. If you ever wondered what the emerging face of a Godzilla El Nino looks like, well, just remember this shot.
NOAA, meanwhile, shows El Nino continuing to extend its foray into strong event range. The critical Nino 3.4 measure of Central Pacific Ocean temperatures jumped again in the July 20 weekly report — hitting a +1.7 C anomaly. This is jump up from last week’s +1.5 C measure and is now knocking on the door to a super El Nino threshold of +1.8 C. NOAA’s three weekly reports for July now average +1.53 C for the Central Pacific — solidly in strong El Nino range for the month.
NOAA also began to track a third warm Kelvin Wave running across the Pacific. This Kelvin Wave is propagating eastward as a result of a strong West Wind Backburst that has blown over the Western Pacific throughout much of July. These winds are pushing warm surface waters down and under the Equatorial region. Ocean heat that will resurface off South American. Recharging already hot waters with a new hot influx and further strengthening an already strong El Nino.
The signal of this new warm water flood is now really starting to show up in the model runs. Corrected seasonal models now show an event in the range of 1997-1998. Uncorrected runs, including the Euro ensemble, continue to show potentials for an event that would make the 1997 Super El Nino look tiny by comparison.
(NOAA’s CFSv2 models still picking up a heat impact murmur of a monster El Nino in our near future. Image source: NOAA.)
Typically, El Nino reaches peak strength during Northern Hemisphere Fall and Winter. So we’re in a ramp-up phase that could last through October and November and we are already starting to hit strong event values in July. The current El Nino is predicted to remain a feature until late Winter or early Spring of 2016. Strongest global temperature heightening impacts come during and slightly after peak ocean warming due to El Nino. So the temperature records we’ve seen so far in 2014 and 2015 may just be prelude to the main event.
Heat Related Mass Casualties in Europe and Japan
It really is the kind of global heat spike that you don’t want to see. The kind that enables heatwaves to put droves of people into hospitals with life-threatening heat ailments. Earlier this summer, both India and Pakistan suffered mass casualty heatwave events. Instances that filled hospitals with tens of thousands of patients. In India, 2,500 souls were lost. In Pakistan, the number hit 1,242. These represent the 5th and 8th most deadly heatwaves on record, respectively.
Now, reports are starting to trickle in that Europe and Japan are suffering similar, although still somewhat less acute mass casualty events due to record heat. According to Dr. Jeff Masters, excess mortality due to heat had claimed more than 1,200 lives across Western Europe through early July. Meanwhile, reports are also starting to trickle in from Japan of heat related mass casualties. A report last week from Japan’s Fire and Disaster Management Agency found that 3,000 people had been admitted for heat stroke to hospitals across the island nation during the period of July 6 through 12.
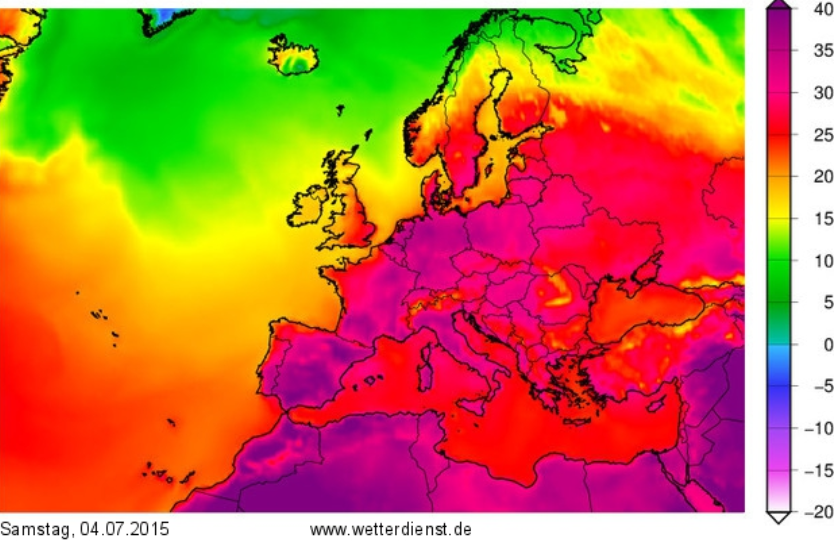
Over the next few days, record-breaking heat is again expected to invade parts of southern Europe, setting the stage for more potential heat casualties.
Conditions in Context — Heat Breaking New Records Means More Extreme Weather
All time record high global temperatures for 2015 and likely at least a decent period during 2016 means we are also likely to continue to experience odd and severe weather conditions over many regions of the globe. A fact that was punctuated in Southern California earlier this week as the remnants of a tropical cyclone dumped 1.69 inches of rain — or more than ten times the amount of rainfall typical for July — over parts of San Diego through Monday. Possibly a taste of what’s to come for California should the currently building Godzilla-type El Nino — pumped up by a catastrophic rate of human greenhouse gas emission — crush the West Coast blocking pattern and hurl a barrage of powerful storms at the drought-parched state. A situation many may be hoping for at this time, but which they could easily come to regret as the extreme intensity of weather switches in the new climate age of 1 C warming start to become evident.
Source: Robert Scribbler































One Response
Why is it that no one ever reports or mentions the holes in the ozone that were caused by each nuclear bomb test ever done? I think it is because our fine governments want us to think it is all our fault, so we should pay them more money, when in reality they are the main cause of the holes in the ozone. They need to stop spraying us with their deadly chemicals.